Version Notes
(Current Version - 3.30.412 - July 15, 2026)
Summary
This update introduces new components and essential bug fixes. A key enhancement has been made to Deeds-McE (Microcomputer Emulator), which now allows users to dock the code editor and debugger windows for a more flexible workspace.
-
 Special FPGA Output Components
-
Equality Detector Components
-
BUS Constant Components
-
3-state Buffer Components
-
Timing Diagram Editing Commands
-
FSM Propagation Time
-
New '.pbs' and '.cbe' File Version
-
Bug Fixes
 Deeds-DcS
Special FPGA Output Components
In addition to the existing standard output component, we have introduced two new output components specifically designed for use with FPGAs (see below).
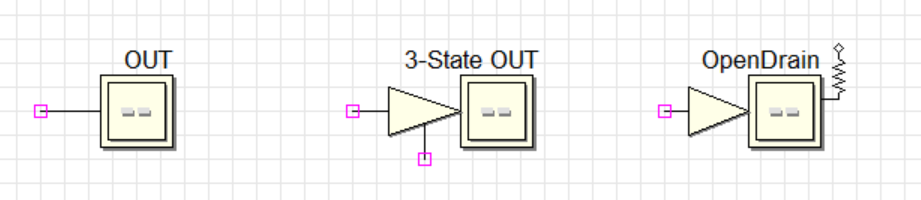
The classic 'Output' component (the first on the left), when used in a project to be implemented on an FPGA, translates into a physical output capable of generating the two standard low and high levels (a totem-pole output).
The two new components, instead, are a '3-state Output' (the one in the center) and an 'Open-drain Output' (the one on the right).
As you can see below, the 'Output Components' menu now offers the two components mentioned above under the new 'Special Outputs' item.
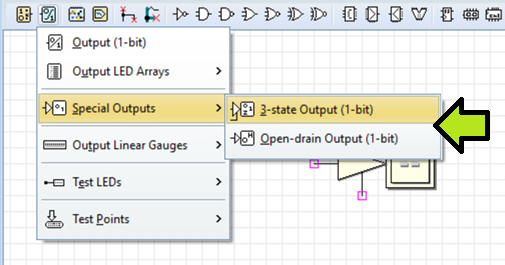
For simulation purposes, these output components connect a 3-state buffer behind the scenes between the wire connection and the actual output (appropriately connected in each of the two cases). In the case of physical implementation on an FPGA, their synthesis is based on the exported VHDL description.
The symbols of the two new components are designed to clarify how they work. However, it should be noted that the open-drain component graphic features a symbolic 'pull-up resistor'. This is only to indicate that the high output level produced (in simulation) would be due to a pull-up resistor in a real-world context. The resistor is not actually implemented in the simulator.
Moreover, in FPGA synthesis, the pull-up resistor must be physically added by the user to the open-drain wire (the value depends on the characteristics of the physical network, but a value between 10 and 100 kΩ is probably appropriate in many cases).
In the interactive simulation, the output of a '3-state Output' component is represented just like a normal 3-state buffer, displaying '0', '1', and 'Z' (High-Z) levels. For the 'Open-drain Output' component, the low level is displayed as usual, but the open-drain state becomes 'H' to distinguish it and emphasize the virtual presence of the pull-up resistor (see the screenshot below, and click to open the example in Deeds-DcS).
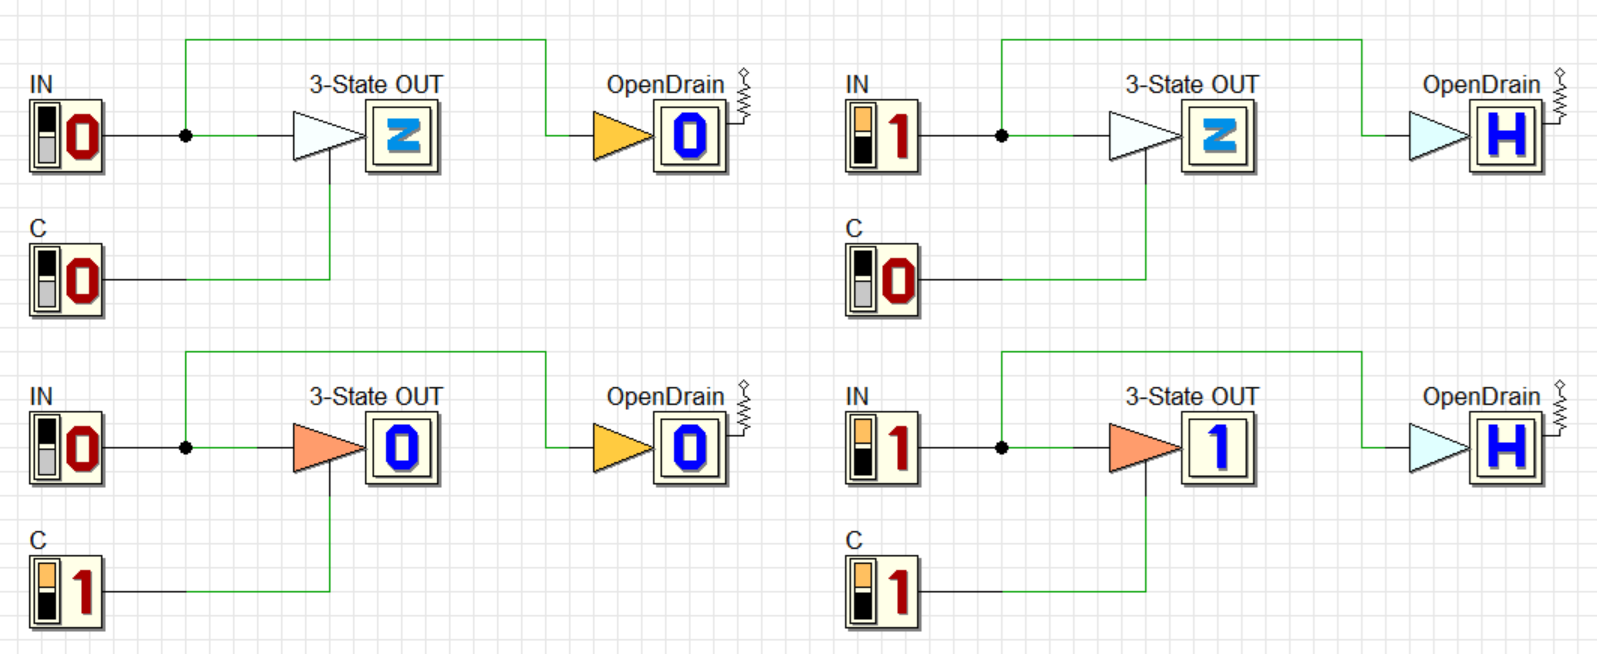
As you can see, during the simulation the components change color depending on whether the output is active or not.
Below is a timing simulation for the above example. Regarding the 'Open-drain Output' component, note that the open-drain state is simply represented as a normal 'High' level, due to the virtual pull-up resistor.
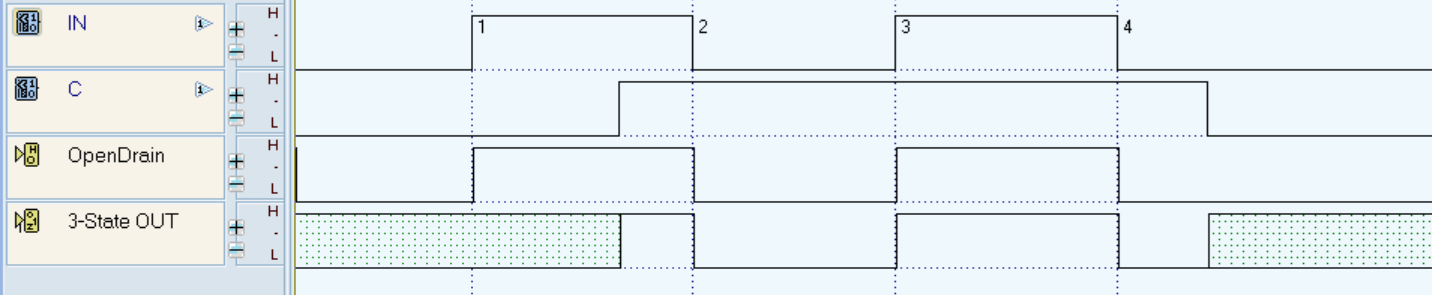
These two new output components have an internal propagation delay, unlike the standard output components (which have zero delay). This delay is caused by the buffer preceding the output. A propagation times table follows, where 'Tphl' = 'High-to-Low' time, 'Tplh' = 'Low-to-High' time, and 'Toff' = 'Level-to-Off' time.
| Output Component | Tphl | Tplh | Toff |
|---|---|---|---|
| Normal | 0 ns | 0 ns | - |
| 3-State | 4 ns | 5 ns | 6 ns |
| Open-drain | 4 ns | - | 6 ns |
While it is permissible to associate the '3-state Output' and 'Open-drain Output' components with the pins of an available FPGA board connector, always ensure that these pins are not already internally connected to other resources on the board, such as LEDs, seven-segment displays, or others.
Finally, please note that these two new components cannot be used as outputs for truth table evaluation.
Equality Detector Components
We have introduced a new group of components, the 'Equality Detectors', derived from the previous 'Magnitude Comparators', with the aim of providing components with more compact symbols. Below is the menu for inserting the new 'Equality Detectors' into the schematic.
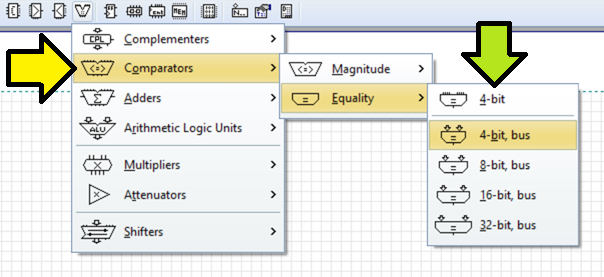
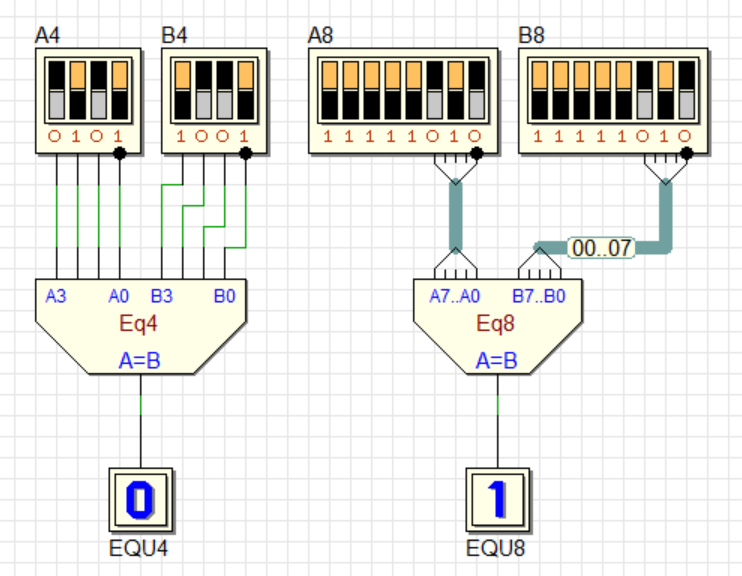
Here's how the various versions (4, 8, 16, and 32 bits) appear when inserted into the diagram. Each has inputs for the numbers to be compared (A and B) and an output ('A=B') that signals the equality of the two numbers.

Here is a simple demo circuit to show how they work (click to open it in Deeds-DcS):
Bus Constant Components
In previous versions, the library included three components capable of providing 4-, 8-, and 16-bit bus constants. This release adds a 32-bit bus constant component, as well as the option to choose between binary and hexadecimal variants. Below is the menu that allows you to choose the component that best suits your needs.
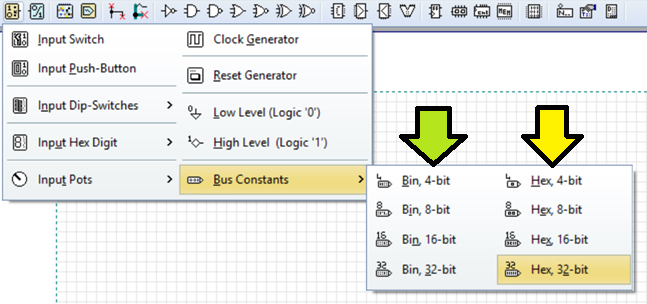
The following screenshot shows the 'Bus Constants' components in 4-, 8-, 16-, and 32-bit sizes, in both 'Binary' (left) and 'Hexadecimal' (right) variants.
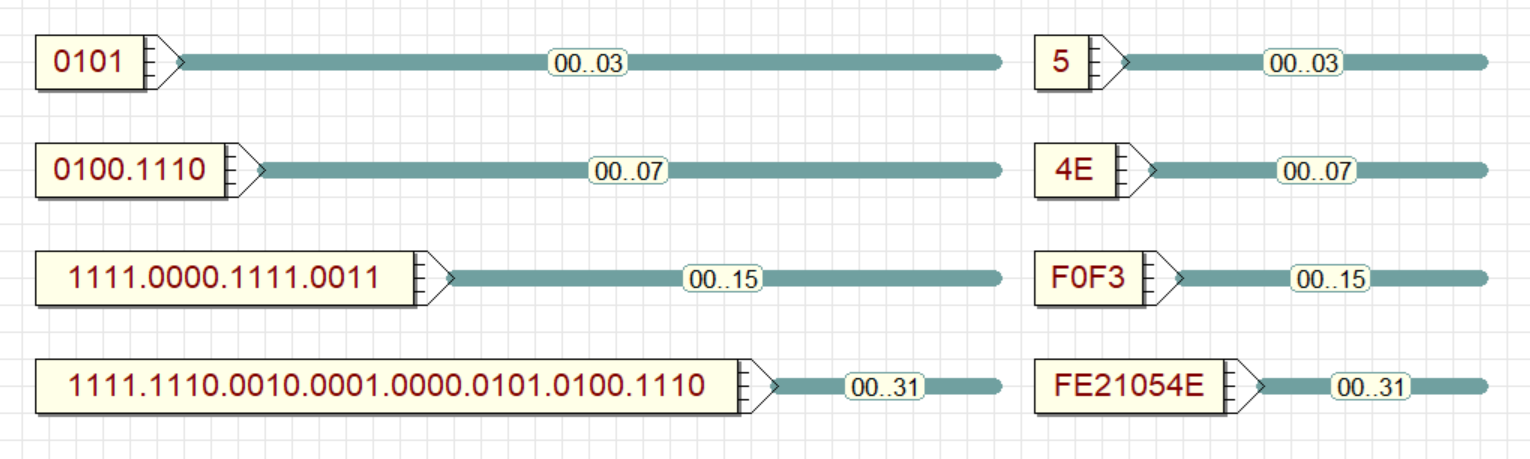
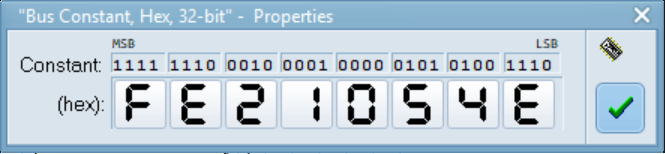
The component that displays the constant in binary is admittedly a bit cumbersome, but it depends on the user's needs, whether it is important to present the number in binary or in a more compact form. Given the increased maximum component size, we have also revised the value configuration window, adapting it for the 32-bit version (see below).
3-state Buffer Components
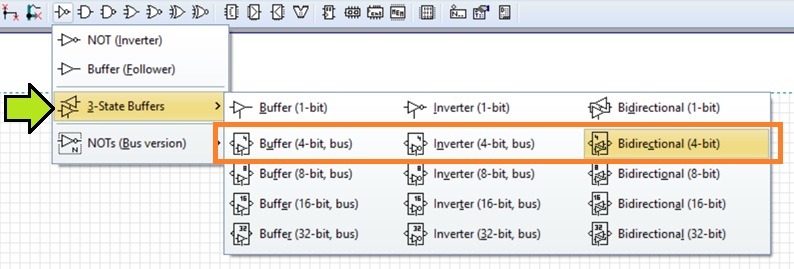
We have added 4-bit, 3-state buffers to the library (previously, only 1-, 8-, 16-, and 32-bit versions were available). The menu items for the new 4-bit components (non-inverting, inverting, and bidirectional) are highlighted below.
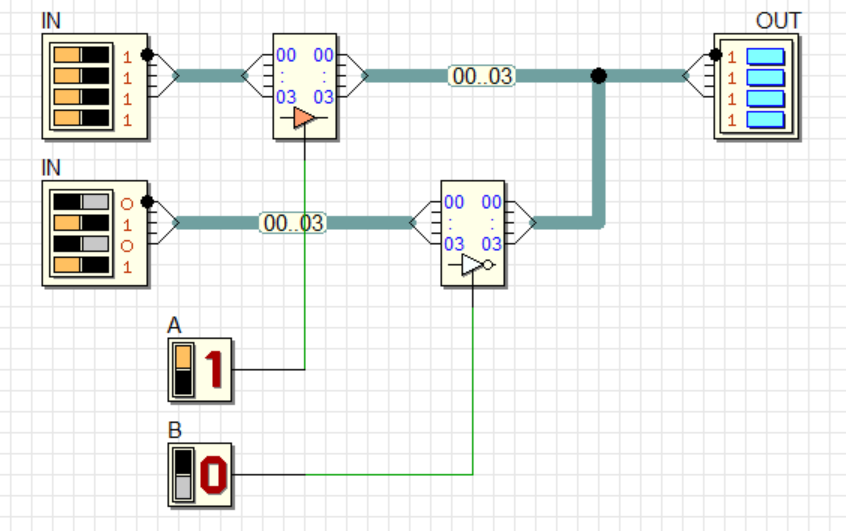
Here's a simple demonstration circuit to test the operation of the newly added 4-bit components (click to open it in Deeds-DcS):
The icons for some menu items have also been fixed (they were previously displayed as 32-bit instead of 8-bit). More over, the propagation times of the 3-state buffers have been revised (see below, where 'Tphl' = 'High-to-Low' time, 'Tplh' = 'Low-to-High' time, 'Toff' = 'Level-to-Off' time).
| 3-state Buffers | Tphl | Tplh | Toff |
|---|---|---|---|
| 4 ns | 5 ns | 6 ns |
Timing Diagram Editing Commands
We have moved the commands for editing signals and defining the grid time step directly to the toolbar. This makes them more accessible and intuitive (see below).
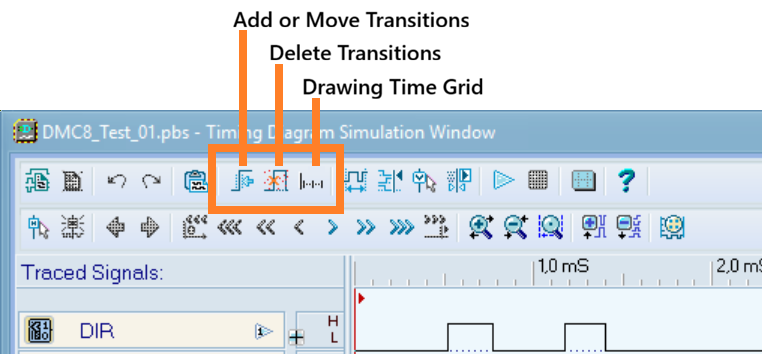
FSM Propagation Time
We have reduced the propagation time of Finite State Machine components from 8 ns to 5 ns.
New '.pbs' and '.cbe' File Versions
The internal format of the .pbs and .cbe files has been updated (version 1.043).
As usual, older files remain fully readable by this new version of Deeds, while files created
with this latest version are not backward compatible with older Deeds-DcS releases.
Bug Fixes
Pasting Components in CBE Schematics
Previously, attempting to paste 'Test Point' components into a CBE schematic would cause the operation to be rejected, displaying an error message. This issue has been resolved, and you can now paste them successfully.
Timing Diagram: Time Grid Command
Fixed a bug where the time editing grid unit selection was not persistent. As a reminder, the menu below allows you to choose the grid time interval used during signal editing.
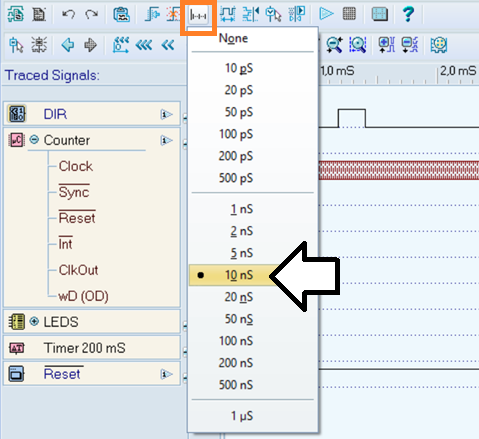
The time grid itself is not displayed, but it affects the positioning and movement of signal transitions during editing. This is useful for positioning transitions precisely, especially when defining multiple input signals that must switch simultaneously.
Timing Diagram: Track Handling Window
The window size persistence for the Track Handling feature was not working properly. This bug has been fixed; the window size is now correctly saved for each individual .pbs or .cbe file. Below is an example of the window that opens via the track context menu.
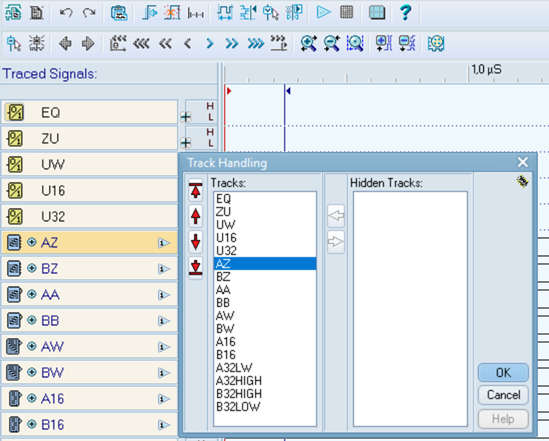
Timing Diagram: Subtrack Visibility Window
The visibility settings for CBE and microcomputer subtracks were working incorrectly. This issue has been fixed. The vertical sizing of the dialog has also been optimized to ensure all subtracks are always fully displayed.
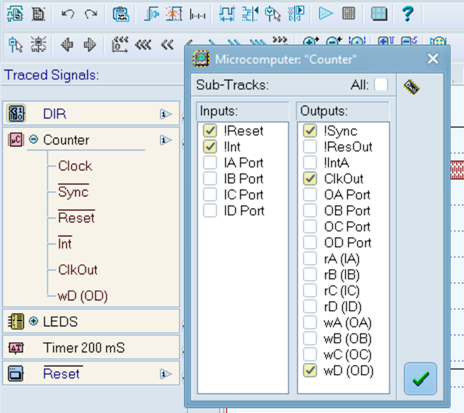
Timing Diagram: Window Placement on Multi-Monitor Systems
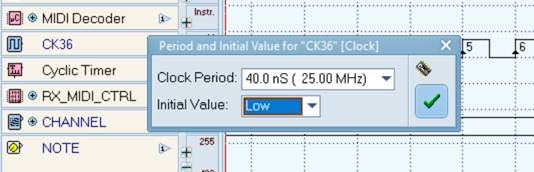
On systems with multiple monitors, the clock settings window, the bus input values window, and several others would occasionally open on the wrong monitor instead of the active one. Below is an example of one of these windows properly positioned.
ADC Virtual Signal Source Window
In the Analog-to-Digital Converter (ADC) Virtual Signal Source window, switching tabs during runtime (from "Analog Generator" to "Sample Files" or vice versa) caused the vertical cursor for the current sample to disappear, even though it was formally enabled. Returning to the previous tab would make the cursor reappear. This issue has been resolved. Below is an example of the cursor displayed during simulation.
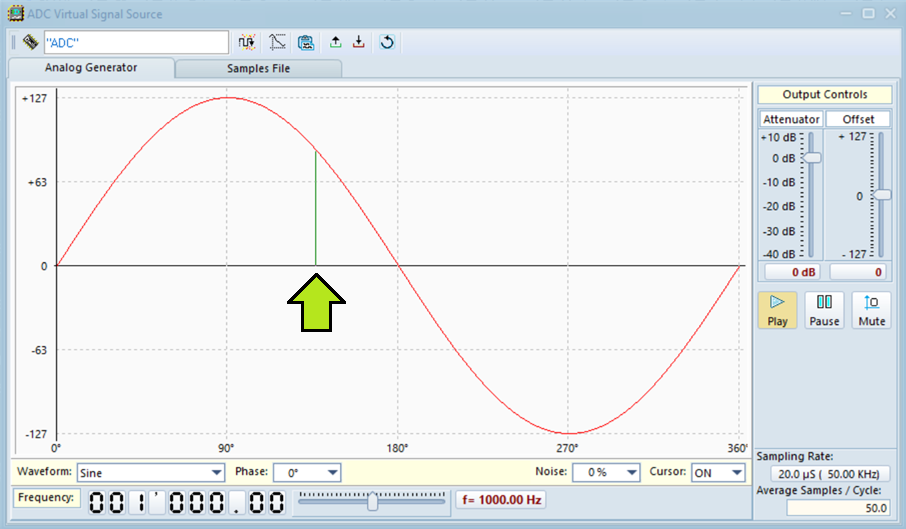
We have also fixed various minor alignment and scaling issues affecting the fields and text layouts within the ADC windows.
Digital Storage Oscilloscope Window
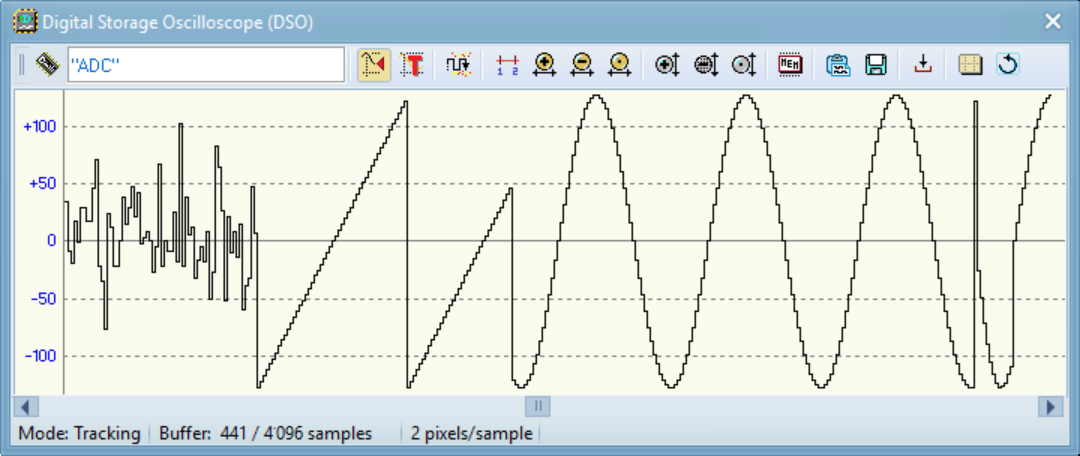
Several display issues affecting the command icons in the Digital Storage Oscilloscope (DSO) window have been fixed. Below is a generic screenshot of the updated DSO window.
Exporting Projects to FPGA
The VHDL exporter for FPGAs exhibited incorrect behavior in the edge case of an empty schematic (i.e., when no components were present). This issue has been fixed.
Test on FPGA Window
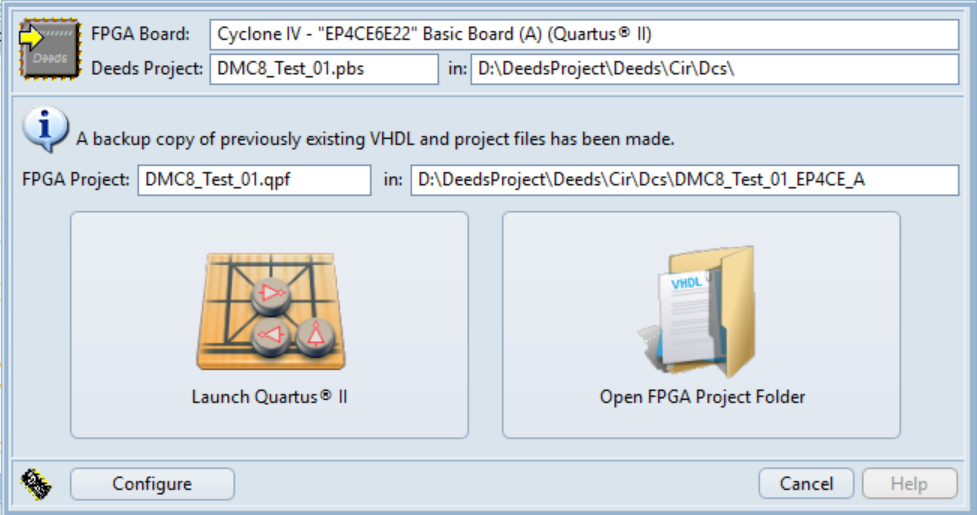
In previous versions, the window that allowed you to launch Intel/Altera Quartus would occasionally fail to appear, causing the program to seem frozen. This issue has been resolved. Below is an example of the current version of this window.
Microcomputer Debugger: Step-by-Step and Run Commands
During simulation, if the object code window was not in the foreground, the spacebar shortcut (the 'Step-by-Step' command) had no effect. This problem has been fixed; the command now responds correctly as long as the focus is on a debugger window related to the specific microcomputer instance.
Additionally, some graphical synchronization issues when starting the microprocessor simulation in Run mode have been fixed (the "step by step" button in the timing diagram was failing to update its state).
Microcomputer Debugger: Program Breakpoints
Fixed several bugs related to breakpoints in the microcomputer simulation. Previously, when exiting the simulation, user-defined breakpoints were not cleared properly, leading to unwanted breakpoints appearing when re-entering simulation mode.
Now, if the simulation is set "for animation," closing and restarting it will require the breakpoints to be set again. If you are using the timing diagram window instead, user-defined breakpoints remain stored for the entire simulation session until the window is closed.
Splash Window
Launching Deeds-DcS by double-clicking a project file displayed the SPLASH window as expected, but launching the application directly from the desktop icon did not. This initialization issue has been resolved.
3-state Naming Standardization
We have cleaned up and standardized the terminology across the entire software suite. Variations like 'Tri-state' and '3-state' have been unified, and you will now see '3-state' used consistently everywhere.
 Deeds-McE
 Editor and Debugger Docking
With this release, the code editor and debugger windows are docked together by default. However, you can still undock them and position them separately as you prefer, just like in the previous release. On the first launch after installation, all windows are set to docked mode.
Code Editor Docked
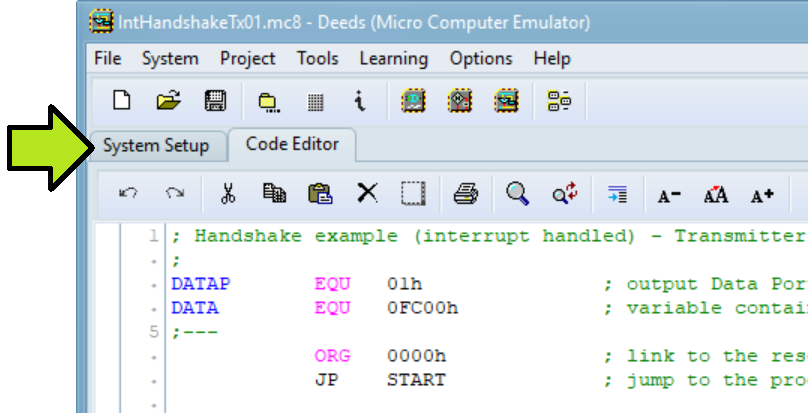
When the code editor is docked, its page is embedded in the main window. In this configuration, the main window features two pages: one for configuring the emulated system's parameters, and the other for the code editor. The figure below shows the two tabs that allow you to switch between them.
Code Editor Undocked
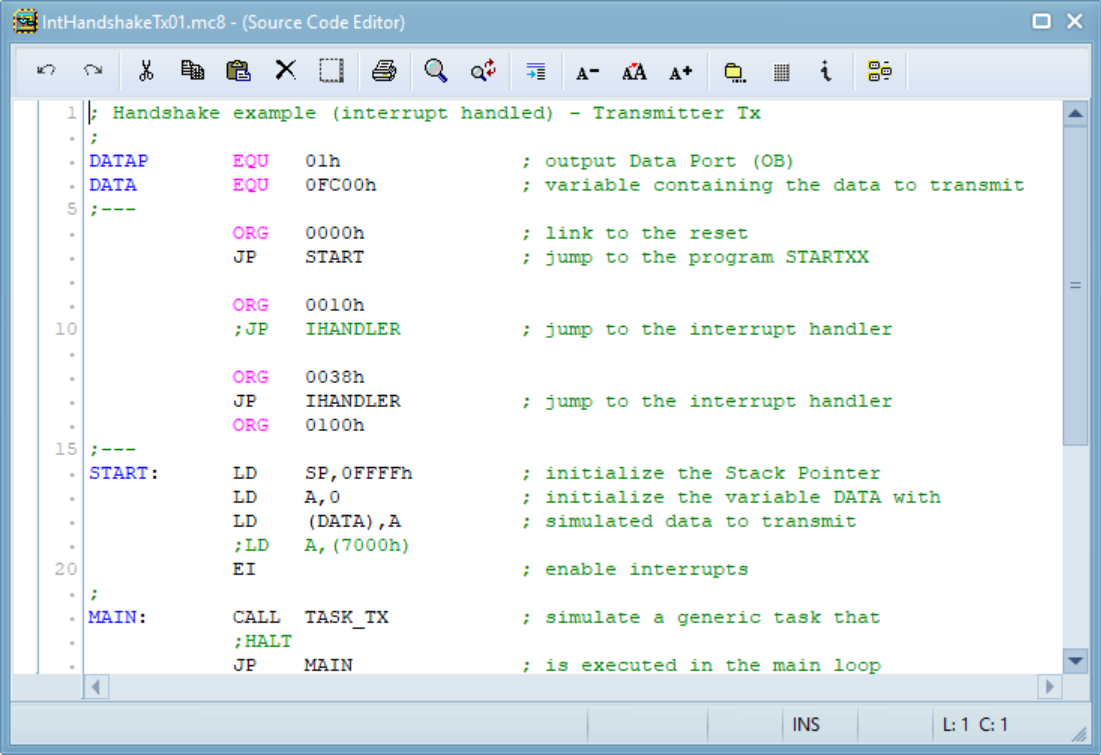
When the code editor is undocked, the main window shows only the controls for defining the emulated system, while the editor is available in a separate window (see figure below).
Dock / Undock Commands (Editor and Debugger)
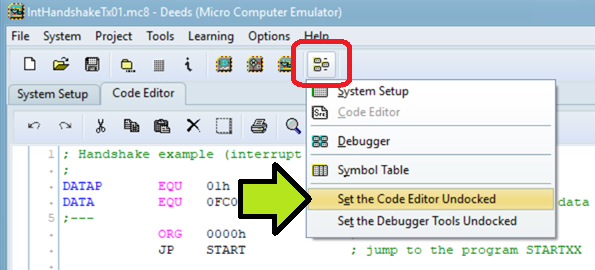
The new commands for docking/undocking the Code Editor and Debugger are located in the menu that opens when you press the "ToolChain" button. This button is available in the toolbars of the main window and other sub-windows (see the example below).
System Setup Controls
The figure below shows the main window displaying the controls used to define the parameters of the emulated system.

Changes from the previous version
Compared to the previous release, some fields have been repositioned: the System Overview panel is now on the far left, and the Reset panel has been moved to the right.
The interrupt panel features updated functionality, as briefly described below, and has been moved to the far right. It allows users to define the interrupt system architecture at design time.
A new field has been added in the center ('Source Code'), where the button allows you to switch directly to the source code editor (regardless of whether it is docked or undocked).
After compiling the code, the program is ready to run, and all system configuration controls are disabled. To make the system status clearer, a panel has been added to the main window that reads: "System emulation in progress" (see below).
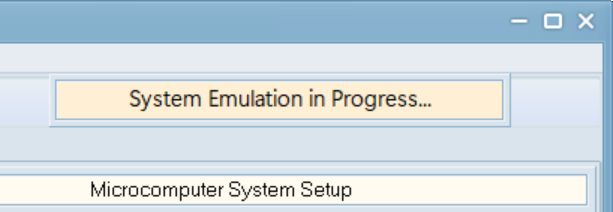
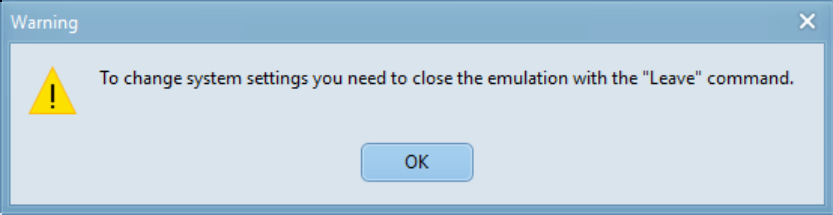
Attempting to click on the various buttons and fields in this state displays the following warning message:
Code Editor Enhancements
File/New or File/Open
If you create a new file or open the application without loading a file, the system definition page is activated by default. However, if you open an existing file, the editor page opens automatically.
Assemble Button
The "Assemble" button launches the assembler (see below), translating your source code into executable binary code for the emulated system.
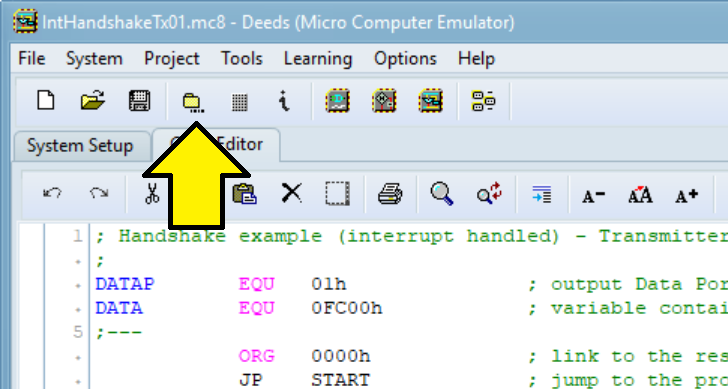
After successfully assembling the source code, the debugger window opens automatically.
Editor Message Area
The message area at the bottom of the editor appears only when there are messages or errors to display to the user. This area can be hidden or redisplayed using the context menu in the status bar or the message area itself.

Find / Replace Commands
The FIND (Ctrl + F) and REPLACE (Ctrl + R) commands have been completely revamped to improve their functionality. These two commands now open an integrated panel at the bottom of the editor rather than a separate popup window.
Find Panel
In the following example, the user placed the cursor on a word and activated the FIND command:
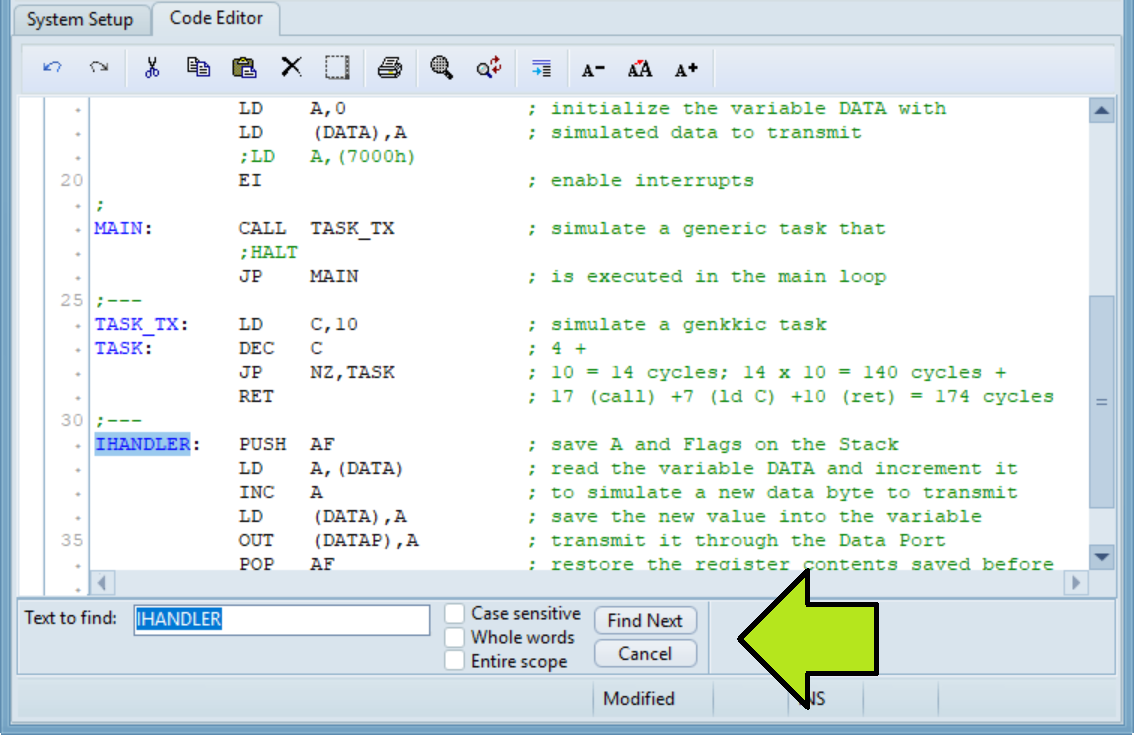
You can configure the search to be case-sensitive, match whole words, and search the entire file (or from the current cursor position onward).
Replace Panel
In the screenshot below, the user wants to substitute the word 'MAIN' with 'MAINLOOP':
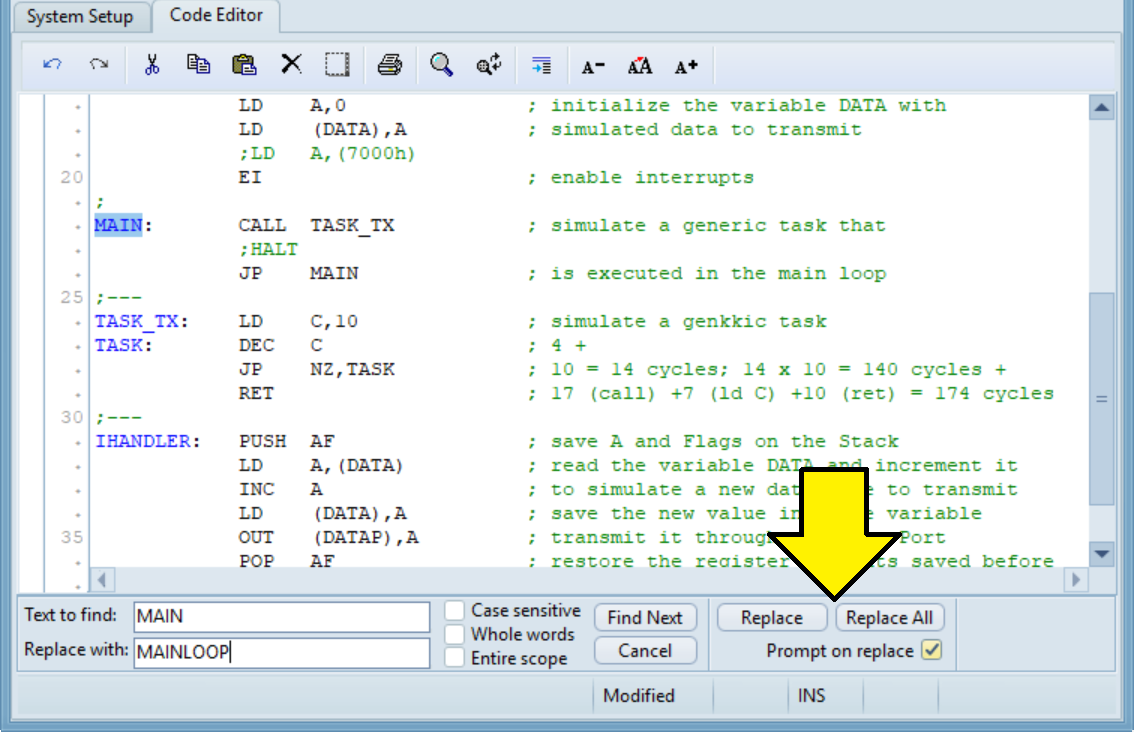
The search functionality is identical to the FIND command, with two additional buttons and one extra option. The 'Replace' button changes the currently selected word, while the 'Replace All' button changes all subsequent occurrences of the word.
The 'Prompt on replace' option, when enabled, prompts the editor to ask the user for confirmation before replacing each found occurrence (as shown in the following example).
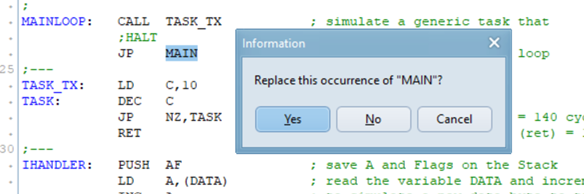
While the search panel is open, double-clicking on a word in the program code will select the text and automatically copy it into the search field, resetting the panel as if it were opened from scratch.
If the user chooses not to replace the current string, the search automatically moves to the next occurrence. Choosing 'Cancel' stops the search operation and closes the panel.
If the search restarts and no further occurrences of the string are found, the editor alerts the user and closes the panel.
Copy and Paste into MS Word
Previously, copying and pasting text from the Code Editor into MS Word did not preserve syntax highlighting and formatting. To retain formatting, you must use the "Paste Special" command in MS Word and select the RTF (Rich Text Format) option, rather than using the default paste command.
Code Editor Bug Fixes
<ESC> Key
Previously, pressing Esc in the editor incorrectly toggled the modified file flag. This issue has been resolved. Additionally, Esc now serves as a shortcut to close the message panel at the bottom of the window (when visible), as well as the 'Find' and 'Replace' panels.
Close Project Command
The 'Close Project' command caused internal software ambiguity and has been removed. Users can achieve the exact same result by using the 'New' command.
Insert or Overwrite Modes
Occasionally, the Insert or Overwrite modes in the code editor behaved inversely to what was indicated in the status bar ('INS' or 'OVR'). This issue has been fixed.
<DEL> Key
In some instances, deleting characters using the Del key failed to trigger the unsaved changes state (the SAVE icon remained inactive). This issue has been resolved.
Ctrl + Home and Ctrl + End Commands
The commands to move the cursor to the beginning or to the end of the file (respectively Ctrl + Home and Ctrl + End) did not always trigger correctly. This bug has been fixed.
Printing Bug
When printing the source code file, the program previously used the font size currently set in the editor. It now uses a fixed-size font optimized for printing 80 characters per line. The font has also been configured as bold to ensure better readability on paper.
In addition, the print icon is now exclusively available within the code editor window.
Right-Click Bug
Right-clicking inside the text area would occasionally clear the current selection and incorrectly jump to the first line of the file. This bug has now been resolved.
Select All Command
In the editor, the standard total selection command (shortcut Ctrl + A) failed to select the text and instead moved the caret directly to the bottom of the file. The command now functions properly.
Debugger Enhancements
Starting with this version, the debugger is once again integrated into a single window, where the various tools of the Toolchain are docked.
However, these tools can still be undocked, meaning each component can be separated into its own independent window, matching the behavior of the previous version.
The Integrated Debugger (Docked Version)
The following screenshot shows the docked layout of the debugger:
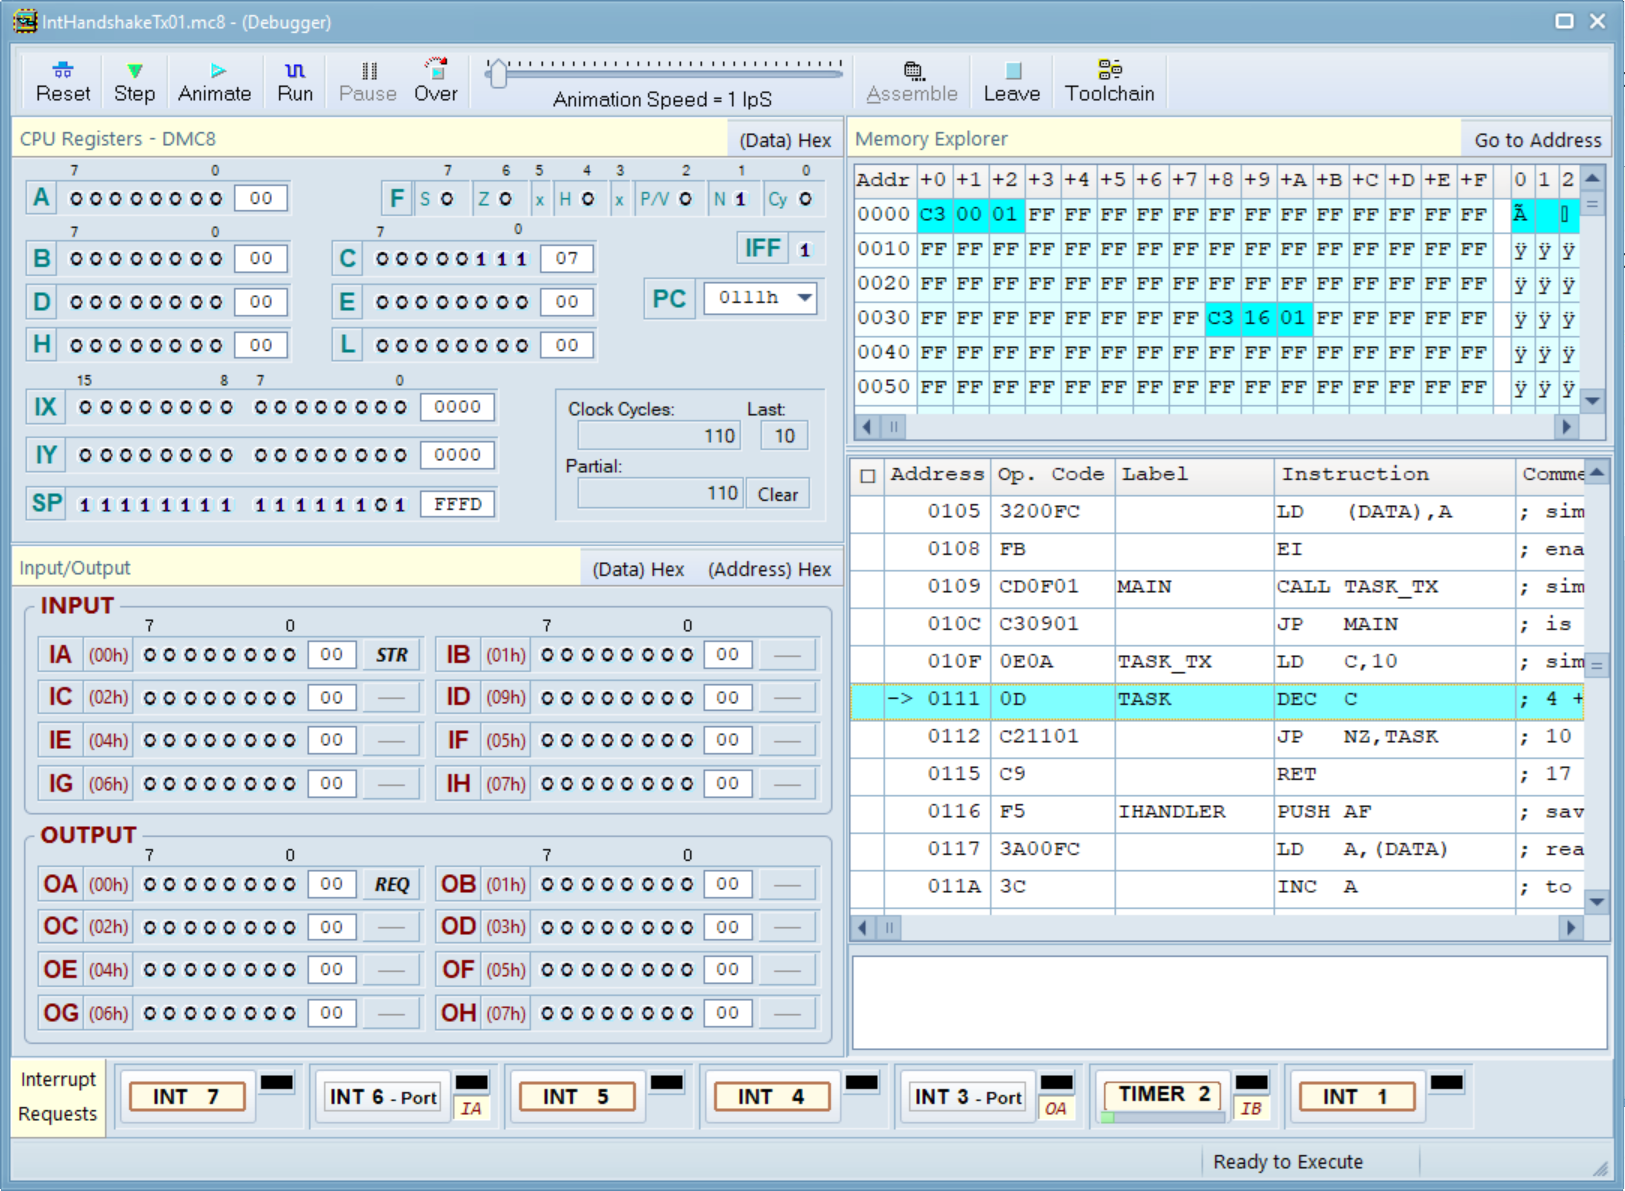
In short, the debugger command bar is located at the top. On the left side, the top panel displays the emulated processor's registers, and the panel below it shows the input and output ports. On the top right, you will find the memory panel, followed underneath by the executable code panel, which allows you to run programs step-by-step, in animation, or at full speed. Finally, the bottom area contains the panel for interrupt and timer controls.
The integrated debugger window enforces a minimum size calculated dynamically based on its contents and the specific system configuration (such as the number of available I/O ports). For the same reason, the interrupt panel dynamically adapts its location and size to optimize space.
The Debugger Tools (Undocked Version)
The next figure demonstrates the interface when all the tools are separated into their own individual windows. These windows can be freely positioned anywhere on your screen. When undocked, the contents and functions of each window remain identical to the docked version.
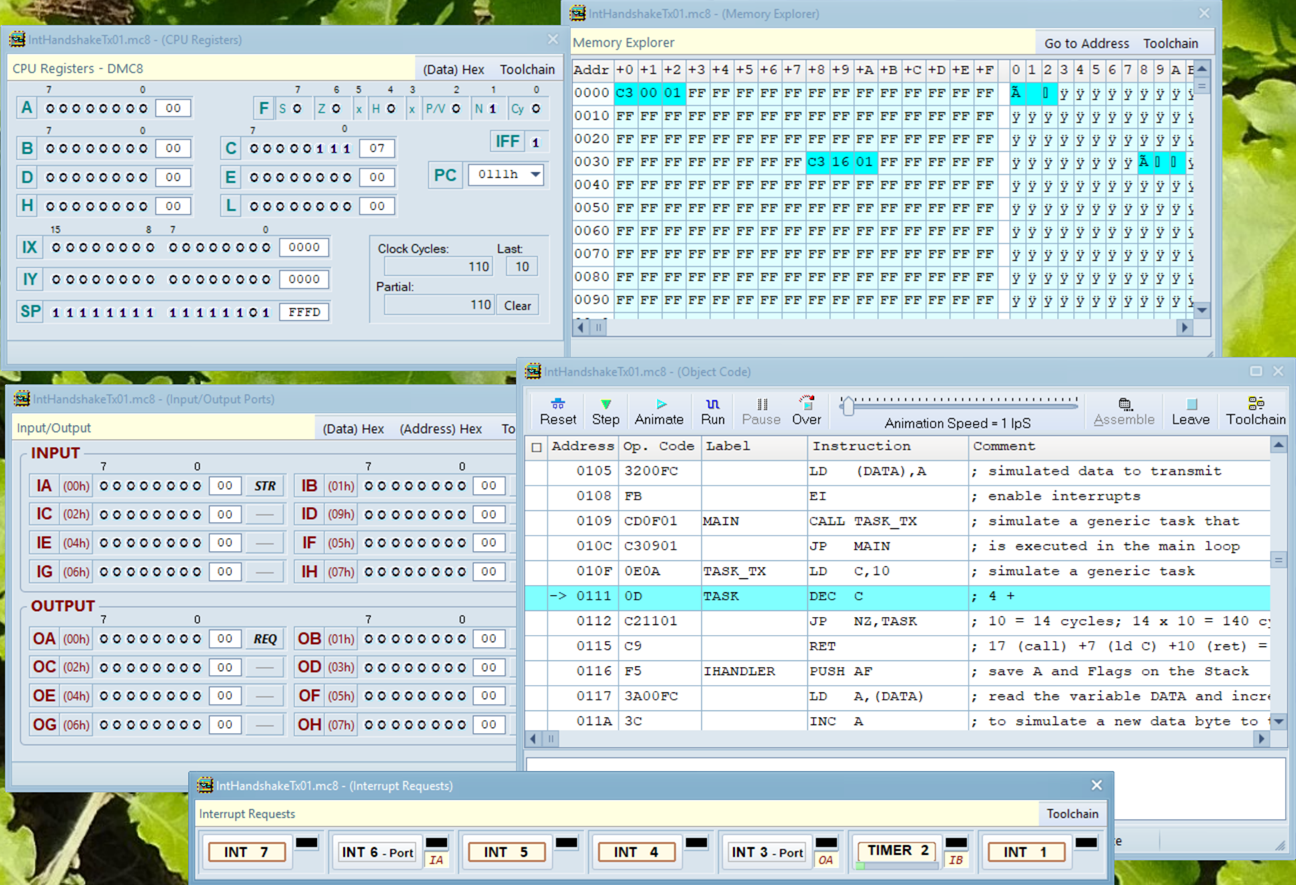
Please note that these screenshots show compiled, executable code. When the source code is not compiled, several debugger commands will be grayed out and unavailable, such as the interactive buttons in the interrupt area.
Debugger Dock/Undock Command
The command for docking and undocking the Debugger tools is located in the menu that opens when clicking the "ToolChain" button (see the example below).
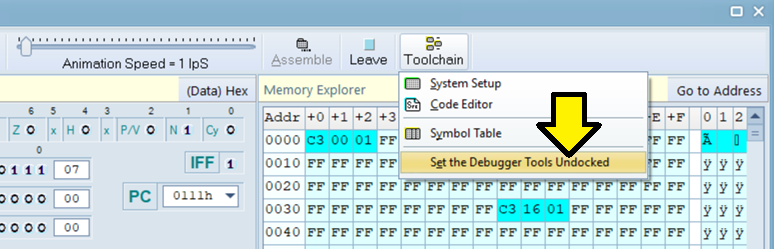
When switching from the docked to the undocked debugger configuration, the application automatically opens all individual tool windows. The screen coordinates and sizes of all windows remain persistent for each specific project file.
Emulated System RESET Button
The RESET button has been repositioned to the debugger toolbar, placed first in line next to the execution commands (see below).

Following this update, the legacy RESET button in the main window is no longer active and has been replaced by an explanatory graphic.
Additionally, the 'Assemble' button (shortcut Ctrl + F9) has been integrated directly into the debugger window toolbar.
STEP Command Shortcuts
The STEP command can now be triggered not only via the F8 key but also by pressing the Spacebar, unifying the control scheme with Deeds-DcS. Furthermore, this shortcut now responds even when the active focus is outside the main debugger window.
Clock Cycle Counter
The Clock Cycle Counter panel has been moved inside the processor registers frame (see below).
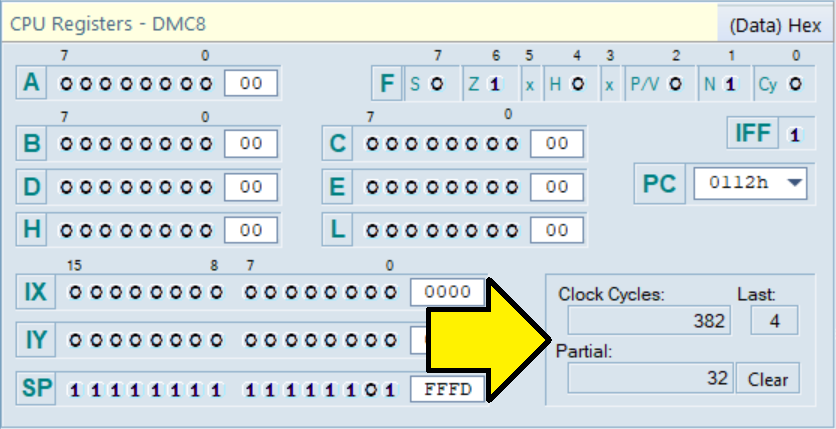
As in previous versions, it displays the total number of clock cycles executed by the emulated system since the last RESET (382 in this example), the number of cycles required by the last executed instruction (4), and the partial cycle count tracked since the Clear button was last pressed (32).
Debugger Messages
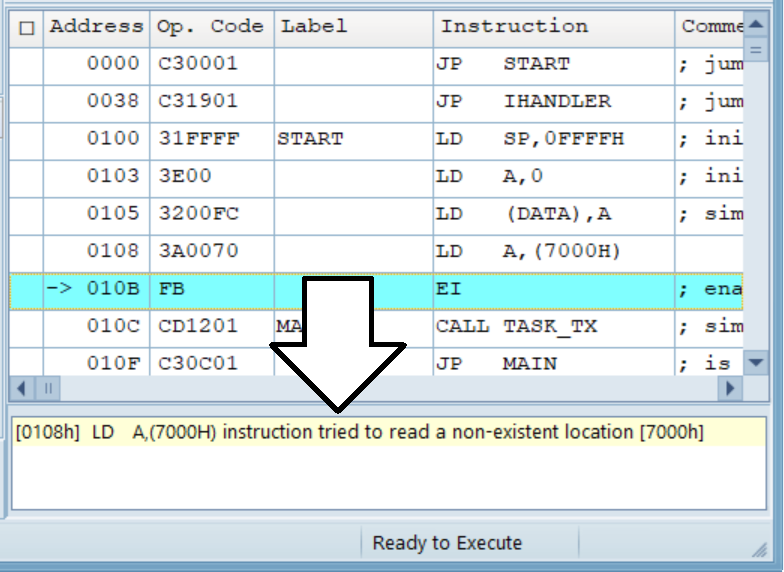
The debugger message panel has been relocated underneath the object code grid to improve space utilization within the debugger window (see the example below).
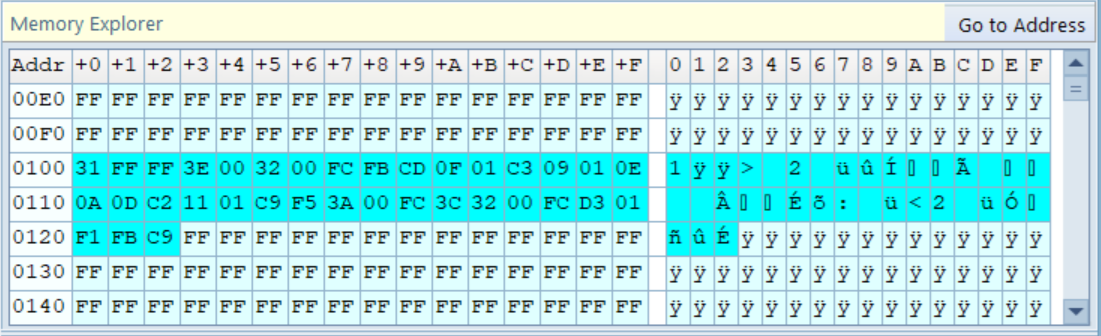
Memory Explorer Panel
The font size of the memory pane has been slightly reduced, and minor font inconsistencies have been unified across the entire component.
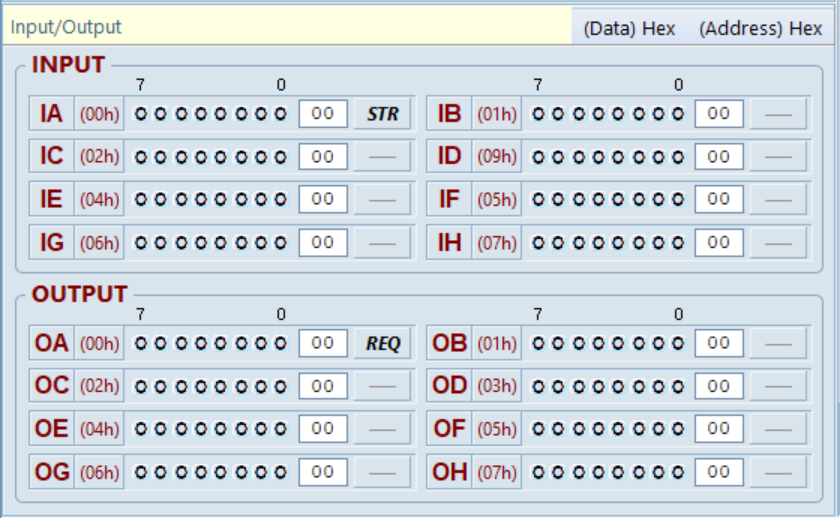
Input/Output Ports
The font size in the input/output fields has also been scaled down. The interrupt request buttons for each port are now permanently visible and are automatically grayed out only when the corresponding port is not configured as an interrupt source.
Object Code Interaction Feature
A new feature designed for pedagogical clarity has been implemented. When hovering the mouse cursor over the executable code grid within the machine code field, the application displays the corresponding machine code bytes for that specific line (indicated below by the yellow arrow).
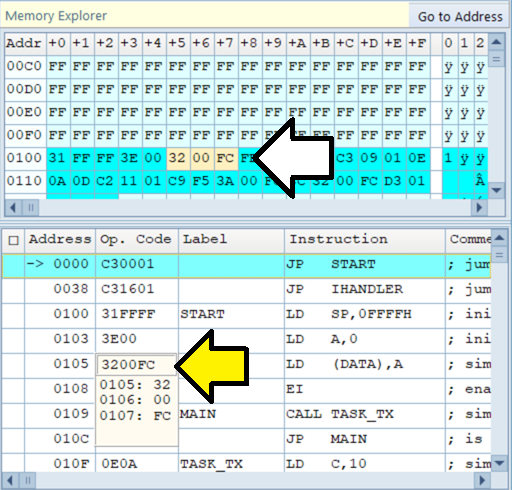
Additionally, clicking on that specific field will temporarily highlight the exact bytes related to that instruction inside the memory grid with a distinct background color (indicated by the white arrow). This visual highlight automatically fades away after a few seconds.
A graphical bug that caused the machine code display to flicker while hovering over the instruction's object code field has also been fixed.
Object Code Auto-Scrolling
During emulation, the instruction currently queued for execution is dynamically highlighted within the object code grid.
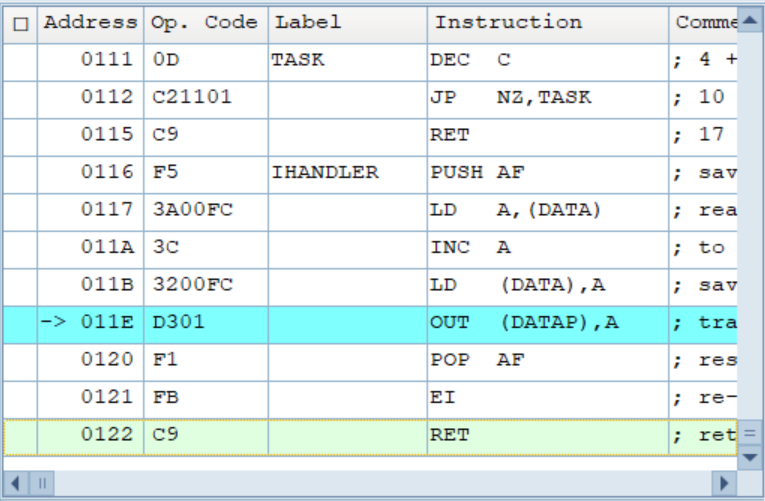
In the current version, if the highlighted line moves past a set percentage of the vertical window height, the object code grid automatically scrolls up by one line. This allows users to better track and observe the upcoming block of code following the active instruction.
Debugger Bug Fixes
Emulation Control Buttons
In the debugger, the emulation control buttons ('Step', 'Animate', 'Pause', etc.) occasionally failed to enable or disable correctly in response to changes in the emulation state.
These controls now behave normally. The visual icon for the 'Pause' button has also been updated with a new color scheme to better differentiate it from its disabled (grayed-out) state.
As a reminder, users must still 'Pause' the emulation before switching to a different emulation mode.
ToolChain Button Behavior
Disabling commands along the object code bar is now handled independently for each button instead of globally. This optimization allows users to access the 'ToolChain' configuration menu even before compiling the source code.
D8080 Instruction Set
Due to a bug, the "SUI n" instruction was incorrectly executed in the same way as the "SBI n" instruction, subtracting the CY (Carry) bit as well. This problem has been resolved (with special thanks to Danil Zolotarev for reporting the issue).
Debugger Message Area
Fixed a bug where, when no specific application style was applied, the message area below the object code grid appeared blank. This was caused by an incorrect light font color choice that made the messages invisible against the background.
 Deeds-FsM
 Properties Window
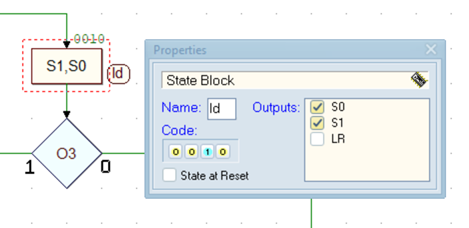
Now, if you switch focus to another application, the properties window will be automatically hidden (if it was visible) and the current object selection will be cleared.
<DEL> Key Bug Fix
Previously, if the focus was inside the properties window (for example,
in the state name field as shown above), pressing the Del key would delete the object
currently being edited instead of deleting a text character.
This issue has now been resolved.
Delete Confirmation
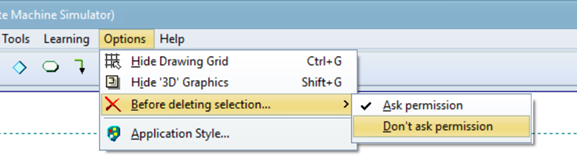
We have introduced a confirmation dialog that prompts the user before deleting an object:
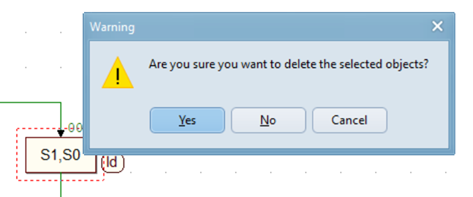
Since this prompt might slow down experienced users, we have added a configuration option in the Options menu to disable it.
All Deeds Tools
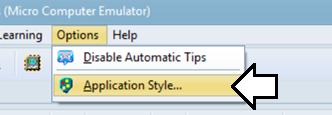
Changing the Application Style
When you change the 'Application Style', a warning message will appear informing you that the current file will be closed.
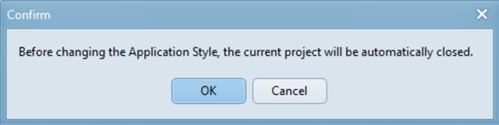
After confirmation, a new window opens allowing you to select the desired style.
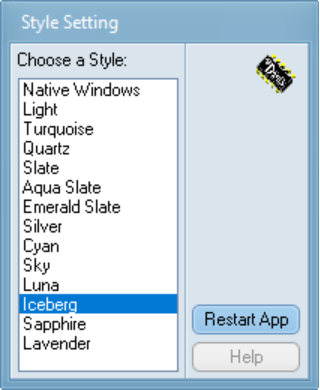
In the current version, the 'Cancel' button has been removed; you can either choose a new style or continue using the currently active (highlighted) one.
Online Help Documentation
The online help documentation for all Deeds tools is continuously being updated and expanded to support the new features.